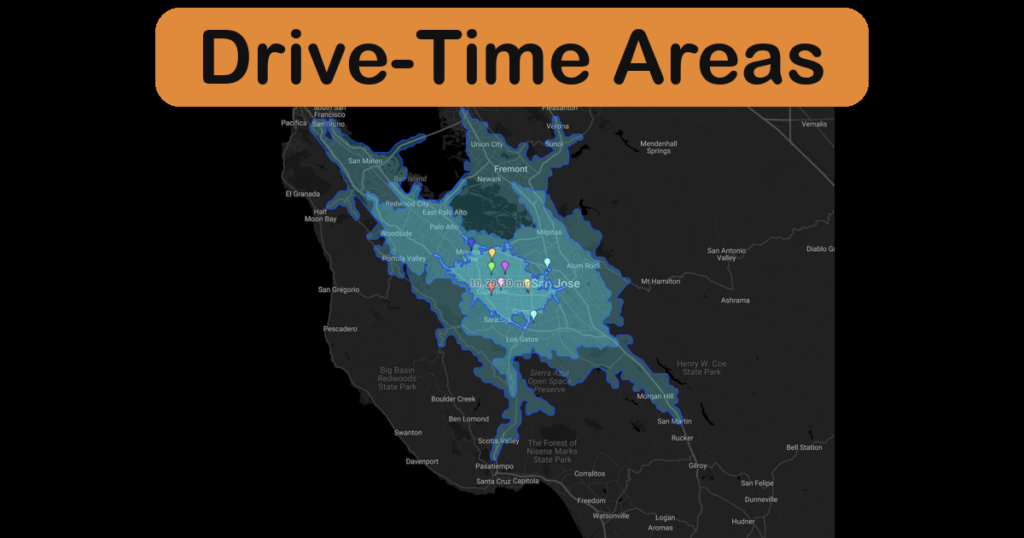
How Far Is 15 Minutes? Introducing Drive-Time Areas
Create an isochrone map in ZeeMaps: highlight drive-time areas around one address, every pin on your map, or a whole spreadsheet of locations.
Create an isochrone map in ZeeMaps: highlight drive-time areas around one address, every pin on your map, or a whole spreadsheet of locations.
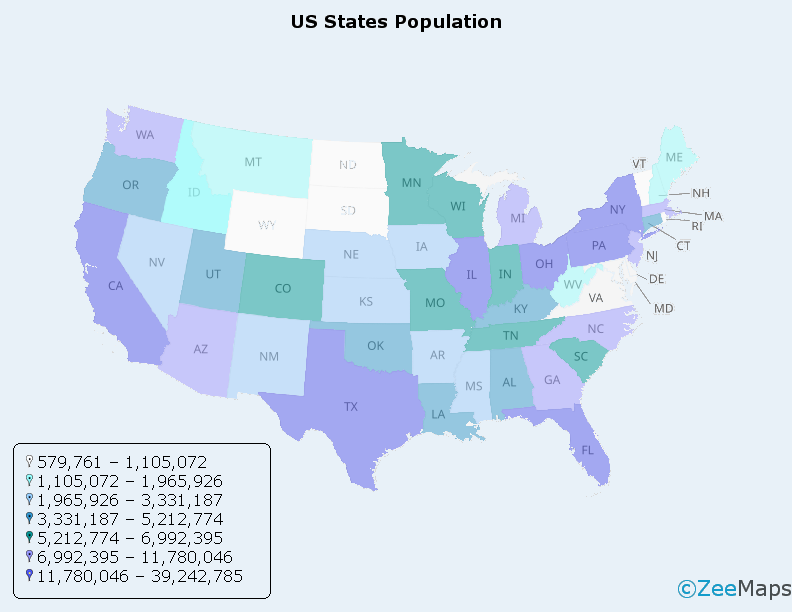
A spreadsheet full of numbers rarely tells a story. A color map by data values tells it instantly. With ZeeMaps’
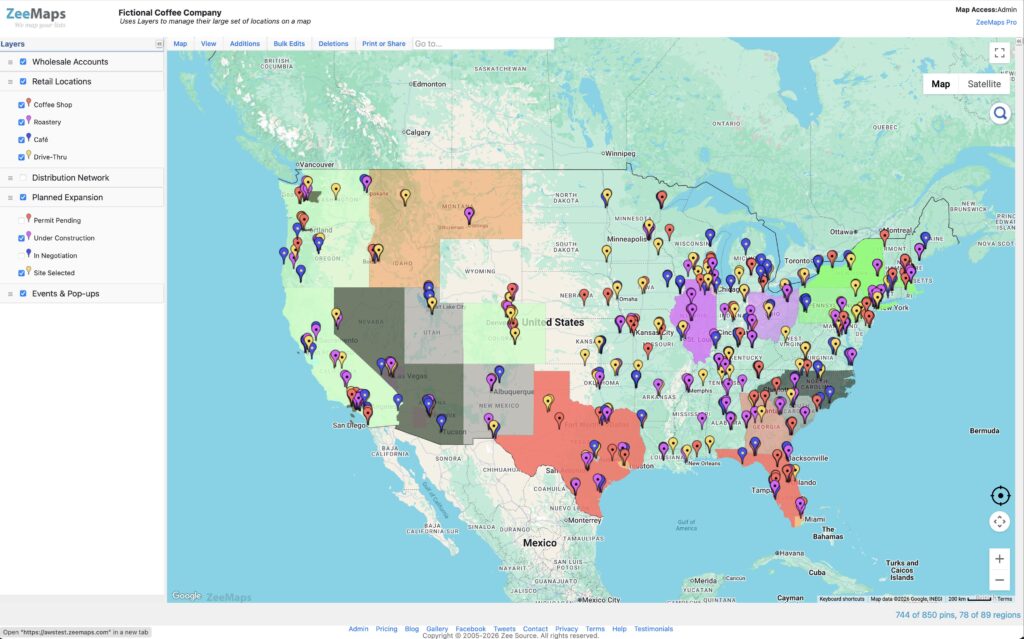
Organize your map data in two dimensions We introduce Map Layers as a foundational new feature for organizing your map data.
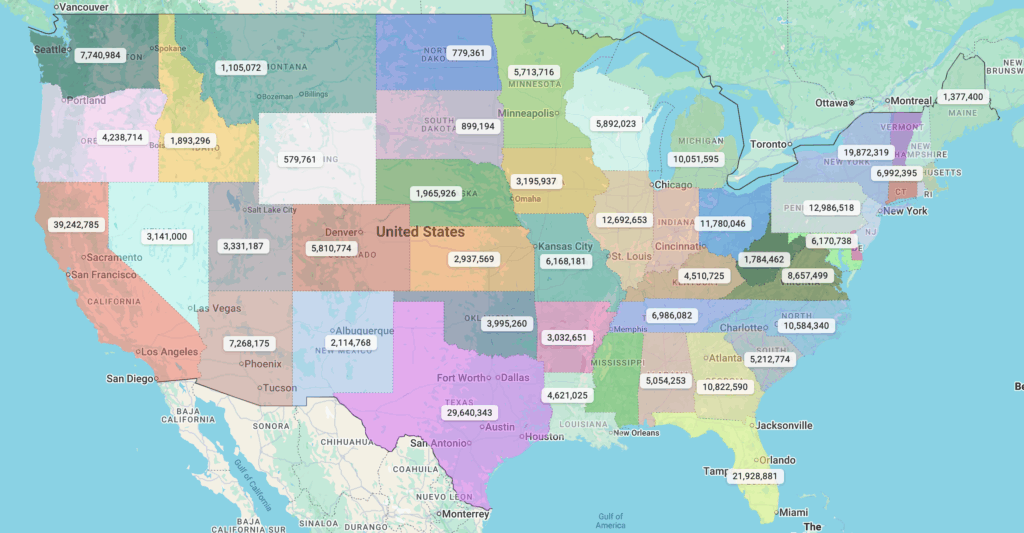
ZeeMaps supports highlighting regions on maps, making it easy to visualize sales territories, service areas, or marketing reach. Highlighted areas are
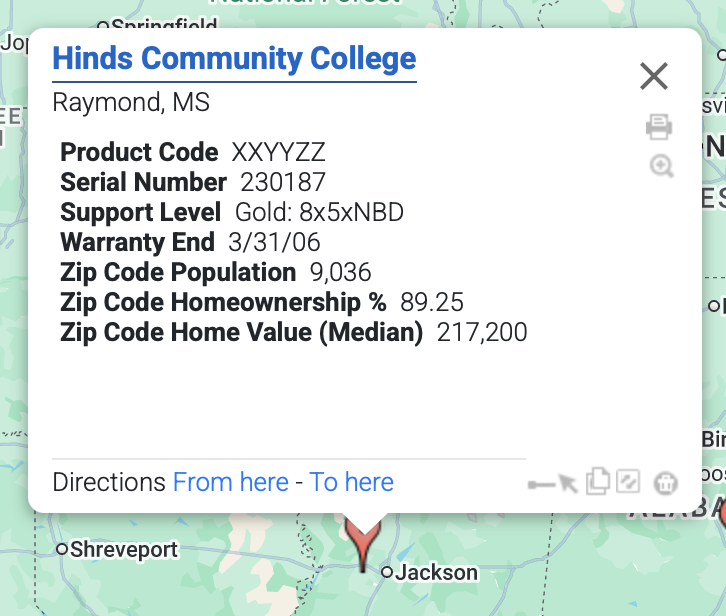
Have you ever wanted to see US Census demographic data directly on your map? With ZeeMaps, you can now add official US

Splitting regions on a map, like by using the continental divide, can be extremely useful. Make a map visualizing regions or splits.