How to Create a UFO Sightings Map with Extended Label Pins
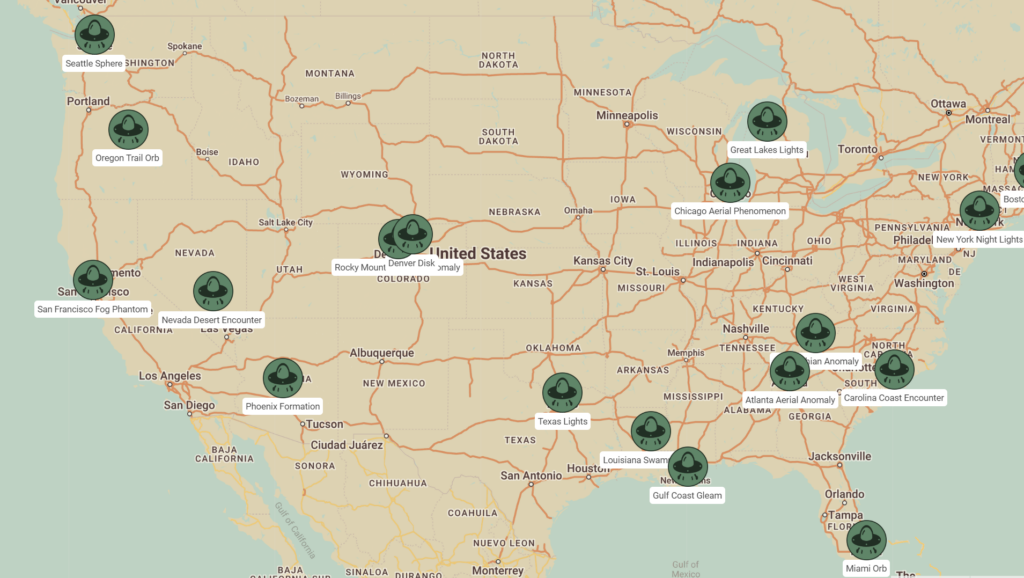
UFO sightings span across America, and with ZeeMaps’ latest feature, you now have the power to depict these enigmatic occurrences with unprecedented clarity.
The days of being constrained to three-character map pin labels are behind us. Let’s embark on a journey to craft a detailed UFO sightings map featuring extended pin labels.