Add Map Markers of Different Colors via Spreadsheet

Suppose you want to add different colored markers, based on a certain column in your spreadsheet, e.g., to distinguish Hospitals and Clinics.
Add a column called “Category” to your spreadsheet, and then enter values such as “Hospital” and “Clinic” in the relevant cells.

ZeeMaps will automatically assign a different color to each category.
If you want to specify the color yourself, then before you upload the spreadsheet, add a legend using the Map -> Legend menu item. Specify the legend values “Hospital” and “Clinic” for the appropriate colors.

The matching is case-sensitive, so make sure that your legend values and category values are exactly the same.

To delete a legend value, empty the legend value in the Map -> Legend dialog and hit submit.

If you want to color markers differently, but not necessarily have a legend, then you can also use color names like blue, green, yellow, etc., in your spreadsheet cells. For a complete list of colors, see the menu item Map -> Marker Icons on your map.

Revised upload limit for Basic plan

ZeeMaps enforces an upload limit for uploading geographical location data through spreadsheets. The upload limit is such that after a spreadsheet upload, the number of entries on your map cannot exceed your upload limit.
Until recently, our Basic (free) plan allowed up to 500 entries to be uploaded per map. Starting today, due to increased operational costs, the upload limit for Basic plan will be set to 100.
This limit does not apply if your data already contains location information (latitude, longitude), or if you add markers one by one (e.g., through crowd source).
Please let us know if you need some time to adjust to this change.

Displace Markers to reduce clutter

Sometimes map markers (pins) can get cluttered on the map if they are too close to each other. Other times markers can overlap, causing just the top one to be visible.
We’ve added the ability to “Displace Markers”, that allows you to un-clutter close or overlapping markers.
To displace a marker, click on the marker to show the information bubble. Then, click on the first icon to the right bottom of the information bubble. (You must be admin, or have added the marker, to see the icons on the right bottom of the information bubble.)
 

Displace Marker
Displace Marker Icon

A small window with the buttons “Done” and “Cancel” will appear, and you’ll be able to drag-and-drop the marker to a displaced location. A thin black pointer will point to the original location of the marker, so you know the actual geo-position.
After dragging-and-dropping the marker to a displaced location, if you click on the “Done” button, the marker will be displaced both in the interactive version of the map, and the static images. If you click on the “Cancel” button, the marker will be re-positioned at its original location.
In the above map, we had two overlapping markers. We displaced the top one, to get the following map:
Two overlapping markers separated

Getting more detailed map images

One of the common questions that we get is how to increase the map details in images obtained through the Print or Share -> PDF/PNG Image menu.
We’ve now added a “Set Scale” option to the image dialog, as shown in the picture below.

Set Scale
Set Scale for map images

As you slide the scale slider to the right, you should get progressively more detailed image for your map. Please note that you have to check the box for “Set Scale” for the scale slider to have any effect on your image. The scale setting is not available for world map images.
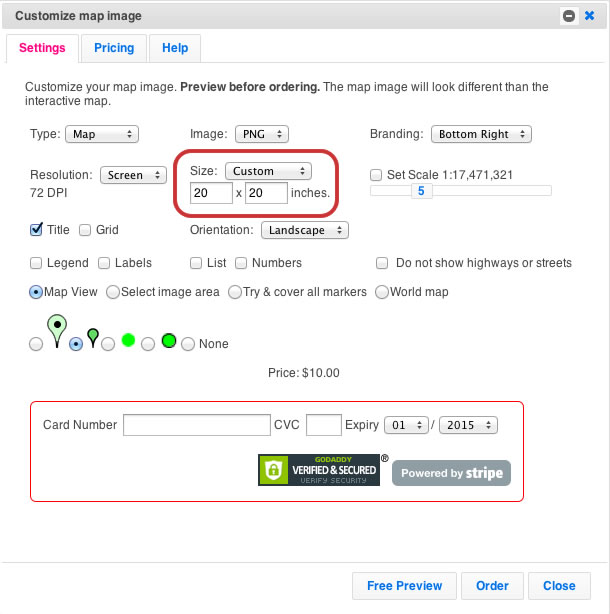
As you get more details, the map area covered by the same image size will naturally decrease. So, you might have to increase the image size, using the “Size” option to get more map area. Use one of the standard sizes, or you can also specify a custom size (in inches) using the “Custom” option.
Set a custom size for map image

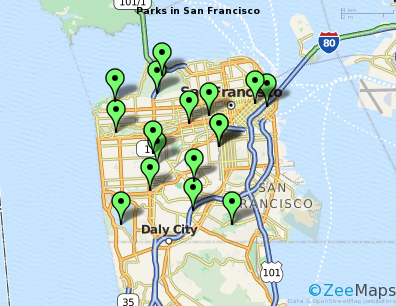
As an example, we generated a half-letter map image from the map: Parks in San Francisco, as shown below.
Parks in San Francisco

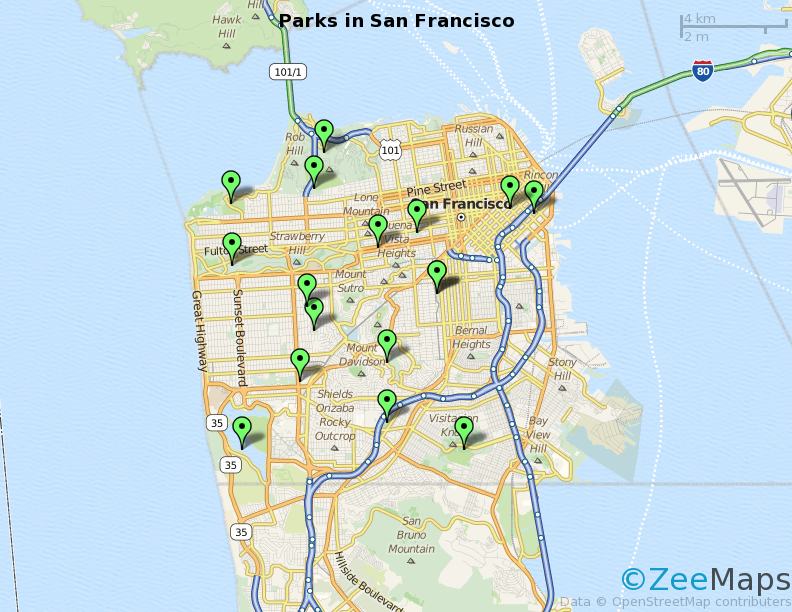
We wanted a bit more details in the map, so I shifted the scale slider two notches to the right to get another image, which is much more detailed than the previous one. I had to increase the size of the image to Letter from Half-Letter as otherwise the detailed map would not fit.
Detailed view of Parks in San Francisco

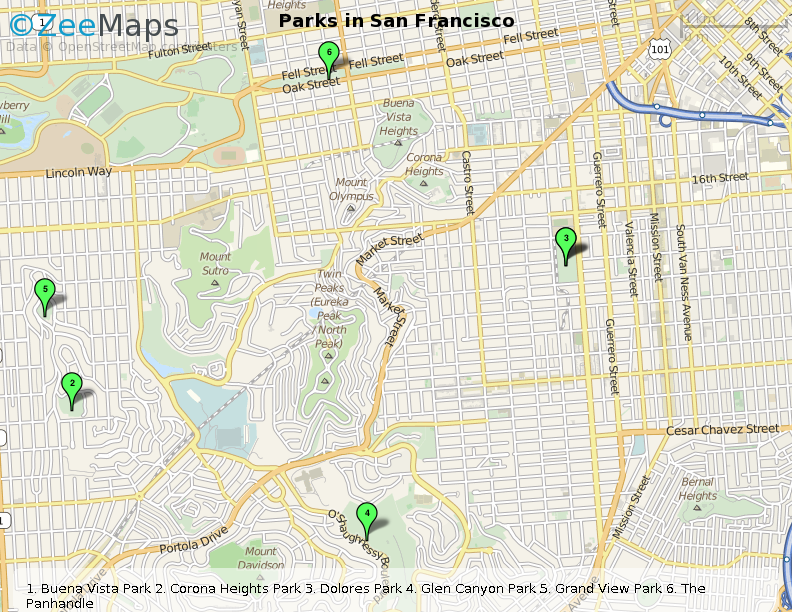
Shifting the scale one more notch, we get this image:
More detailed map image for Parks in San Francisco


Region improvements and pricing

We’ve made it easier to specify color and boundaries, when you add or update a geographical or geometrical region on your map. Instead of specifying a color number and opacity, you can now select a color from a color picker and use an opacity slider.

Color and Opacity Picker for Regions

With this change, we are also limiting the number of regions you can add per map depending on your subscription level as follows:

  • Basic: 5 regions per map
  • Professional: 10 regions per map
  • Professional Publisher: 15 regions per map
  • Enterprise: Unlimited regions per map