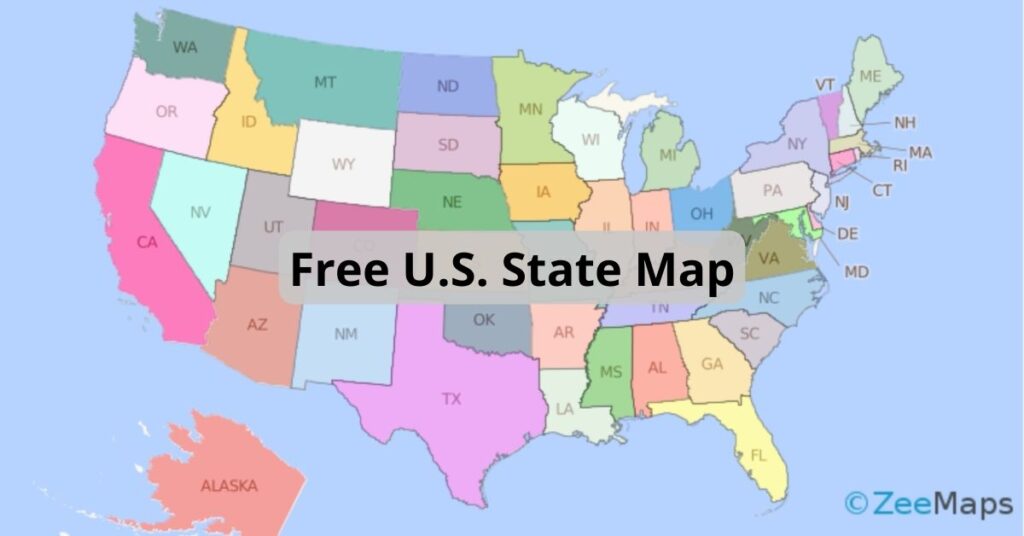
Download a Free U.S. State Map That Uses Extended Colors
ZeeMaps has more than doubled the colors available to users with an Enterprise Plan. Download this free U.S. state map to use them all.
ZeeMaps has more than doubled the colors available to users with an Enterprise Plan. Download this free U.S. state map to use them all.
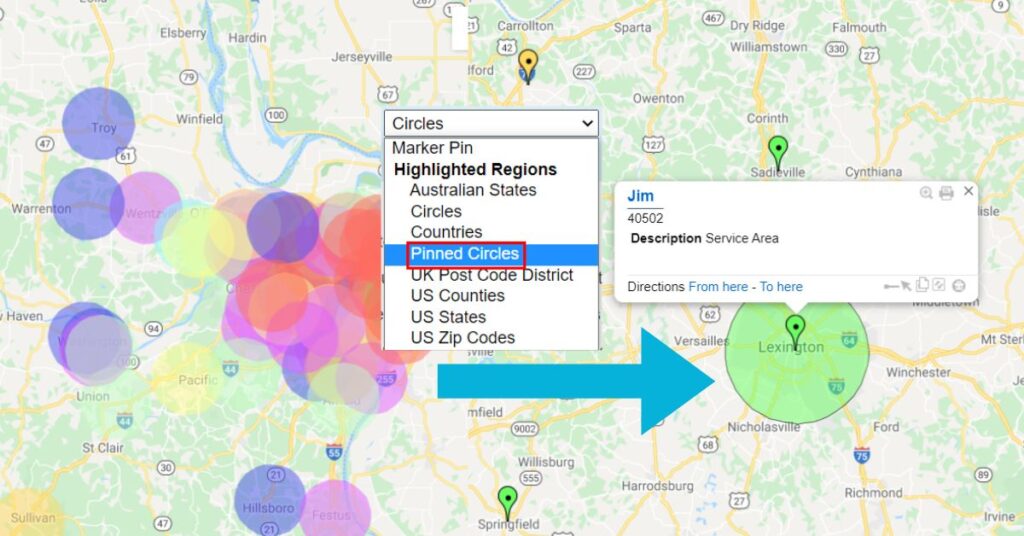
Adding pinned circles to a map allows for increased capabilities and visibility when displaying radius, in cases such as a sales territory.
ZeeMaps provides easy mechanisms to highlight various geographies (e.g., countries, states, cities, zip codes) and geometries (polygons, circles) on a
ZeeMaps allows you to add simple or detailed markers to a location map. You can do this individually, or in
There are some ZeeMaps features that are particularly useful for people organising garage sales, yard sales or even estate sales. One
ZeeMaps now allows you to highlight US Zip Code areas on a map by uploading a spreadsheet with address and