Heat Map Visualization in ZeeMaps

Heat Map Overview

Heat map, a density visualization technique, shows areas of high and low concentration on a map. While, a point map with 10’s of thousands of locations can become cluttered, a heat map visualization of the same data can quickly show areas of dense population.

For example, if you plot the locations of all your customers as a heat map, you can quickly see where there are pockets of low or high number of customers.

ZeeMaps provides support for a these maps in both the interactive and print versions. Currently, we look at the frequency, or number of points at a given location, to determine the density. Over time we’ll extend this to allow for the density value to be determined through one of the the marker fields.
Notice, you can combine this feature with the Zip Code Finder tool in ZeeMaps.  Finally, a great way to quickly determine the zip codes with high density of points on a map!

Example Map

Here’s an example of a heat map of locations of all the Used Computer Stores in the US. First, with the map, one can quickly see that Boston and New York are the most dense areas. While, other major cities like San Francisco, Dallas, etc., have some notable presence as well.

Now, click on the icon at the top right of the map. Notice, the display will change to the regular clustered point map.

We can also get an image of the same map, using the menu item Print or Share -> PDF/PNG Image. In the resulting dialog, we check the option for “Heat Map” for the pin style.

Heat Map of Used Computer Stores in the US
Map of Used Computer Stores in the US

Setting a Heat Map in ZeeMaps

Turn on the this feature for your map. First, go to the settings page (menu Map -> Settings). Second, click on the Map Display tab. Third, check the box for “Enable Heat Map” and hit Save Changes. Last, go back to the map to view the change. Finally, there will be a small icon at the top right of the map (see interactive map above). You can click on that icon to toggle the display from a heat to a regular point map.
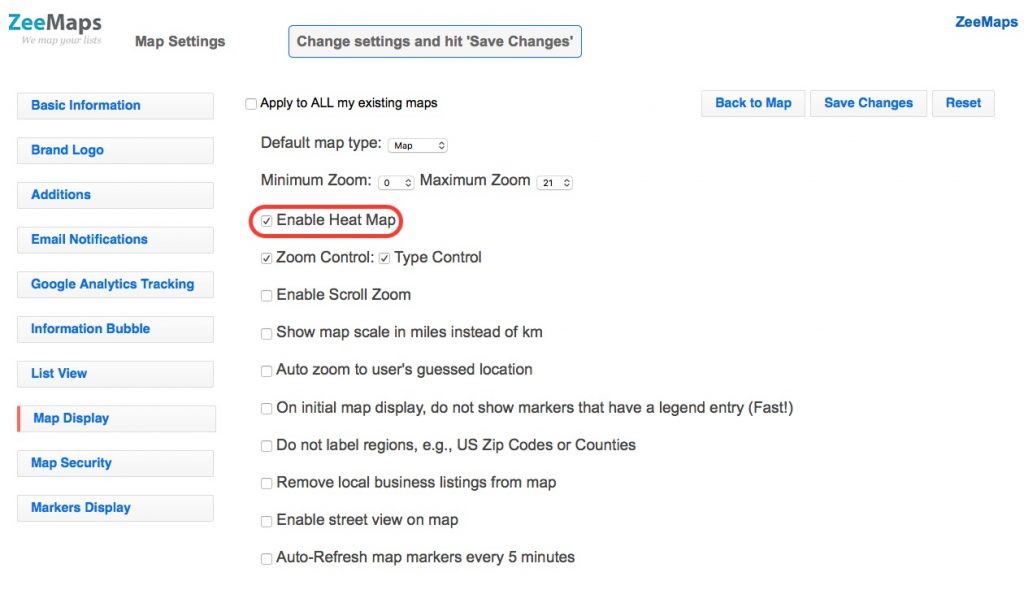
Enable Heat Map in ZeeMaps
Enable in ZeeMaps

Geo Maps Auto-Refresh Updated Display

Geo Maps Overview

Often, it is useful to show continuously updated geo maps. For example, geo maps updated by a large number of field operators. In the field, operators can indicate status change for job sites by changing the color of markers on the geo map. Similarly, crowdsourced geo maps would show updates from the field as new locations are added. For such geo maps, it is often desirable to display the geo map on a large screen, visible to several users and employees to monitor progress. This can also be useful in conferences, e.g., where each attendee marks their location of origin or interest. In classrooms, you can use such geo maps for students to mark their locations.
Manually refreshing the geo map screen every so often becomes tedious quickly. It is much better if the geo map can refresh itself every few minutes.
ZeeMaps allows you to set up your geo map for auto-refresh. Once set up for auto-refresh, you can leave the geo map visible on a browser window and it will automatically refresh itself every five minutes.

Enabling Auto-Refresh for Geo Maps in ZeeMaps

To enable auto-refresh of your geo maps, use the Map -> Settings menu to go the settings page. Click on the Map Display tab in the settings page. Check the box for “Auto-Refresh map markers every 5 minutes”. Hit Save Changes.

Map Settings menu
Map Settings Menu item

Setting for Auto Refreshing Geo Maps
Auto-Refresh your Geo Maps

To recap, ZeeMaps provides many ways of making changes to geo map markers concurrently by many users. Users can add more locations to a geo map. They change the status of a geo map marker by changing its color. Manually refreshing the geo map on a continuous basis is tedious. ZeeMaps’ capability auto-refreshed every few minutes makes it much easier to setup overview geo maps for a groups of users.

Google Maps Scale in Miles — Change from Kilometers

By default, Google Maps scale is displayed at the bottom right of the map in kilometers (or meters at close range), as shown in the diagram below.

Google Maps Scale in Kilometers
Google Maps shows scale in km

If you want to see the Google Maps scale in miles (or feet), you’ll need to click on the scale to switch between kilometers and miles. This is okay once in a while, but can become irritating if you have to do it all the time for your maps.
We’ve added a new customization where you can specify that you want the scale in miles for your map.
To change this setting, use the Map -> Settings menu to go to the settings page on your map menu. Then, click on the Map Display tab, check the box for Use “Miles” scale control, and hit Save Changes. Go back to your map and the scale should now be in miles instead of kilometers.
Map Settings menu item

Change Google Maps scale to miles in ZeeMaps
Change map scale to miles in ZeeMaps

OneDrive Spreadsheets: Map Location Data

ZeeMaps allows you to create interactive maps from location data stored in Microsoft’s OneDrive spreadsheets. ZeeMaps can periodically update the map as the spreadsheet changes.
You upload and attach your OneDrive spreadsheet to a map only once, then the map can be automatically kept updated as your spreadsheet changes. This way, you do not have to worry about making changes to both your spreadsheet and your map.
In order for this to work, make sure that you do not:

  1. Change the name or location of the spreadsheet
  2. Change the columns of your spreadsheet.

If you make any of the above two changes to your spreadsheet, then you must delete all data from your map and re-upload and attach your spreadsheet.

Attach a OneDrive Spreadsheet to a map

To attach a OneDrive spreadsheet to a map, first create a map on ZeeMaps. Use the Additions -> Upload (Copy-Paste) Spreadsheet menu item on your map, and then select the Cloud Drive Spreadsheet Option.

In the Cloud Drives drop-down, select the Microsoft OneDrive option for the Provider control, and hit the Fetch My Spreadsheets button.

Periodically Update Map from OneDrive Spreadsheet changes

At this point, a window should be activated that asks you to sign-in to your Microsoft OneDrive account and give ZeeMaps access. Once you’ve granted access, you should see a list of your spreadsheets and be able to select the spreadsheet that you want to upload to the map. From here on, follow the steps for uploading a spreadsheet to a map.
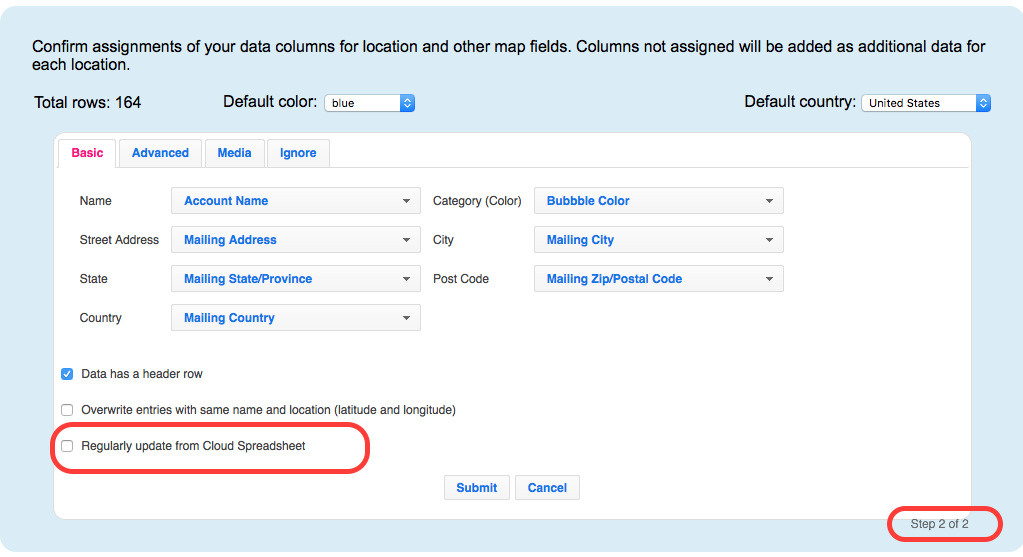
If you want your spreadsheet changes to be automatically reflected on your map, make sure that you check the option for “Regularly update from Cloud Spreadsheet” in Step 2 of the confirmation process for the upload:


From then on, the map should be automatically updated when your spreadsheet changes.
To see what spreadsheets are attached to your map, use the View -> Cloud Drive Sheets menu item on your map.

US Map – Get Map of USA Images using ZeeMaps

You can get US Map images from ZeeMaps in different sizes and resolutions, e.g., to print out a wall-poster, or include in a PowerPoint slide.
On your interactive map in ZeeMaps, click the Print or Share -> PDF/PNG Image menu item to get the dialog to customize your image.

Print Image menu item and customization dialog
Dialog to customize your print image in ZeeMaps

The first option in the customization dialog is for selecting the “Geography” of your image. This allows you to choose from one of the following options:

  • Cover Markers – include all the pins or markers that are placed on the map
  • Map View – use whatever is visible in the map window currently
  • Select Area – select an area of the map using a rectangle
  • US Map- make a US Map (possibly with Hawaii, Puerto Rico and Alaska included)
  • World Map – map of the world

US Map of Used Computer Stores

Select the option for “US Map” to get an image of a US Map with all your customizations overlay’d on it. For example, here’s an image generated from our Used Computer Stores map, with Alaska and Hawaii excluded:

US Map of Used Computer Stores

We can also generate a US Map image with Alaska and Hawaii included:
US Map of Used Computer Stores with Alaska and Hawaii

The images are available as a political map with state boundaries, or as a satellite map:
US Map of Used Computer Stores, Satellite Version

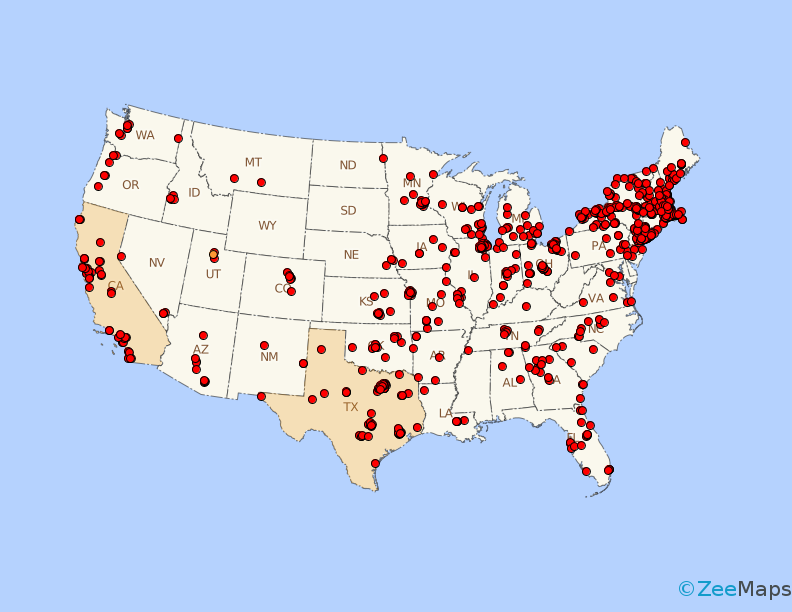
Finally, if you want, you can highlight certain regions on the map, e.g., below we highlight California and Texas:
Map of USA with States Highlighted

In this post, we’ve shown a limited set of samples of US Map generated with ZeeMaps. The image customization dialog contains a whole other set of customizations, e.g., selecting the type of markers on the map, the size and resolution of the image, whether you want the markers labeled or not. We invite you to experiment with the myriad of options and contact us in case you need some assistance.