A radius map showing UK office locations and their reach

Radius map: Upload circles on a map from spreadsheets

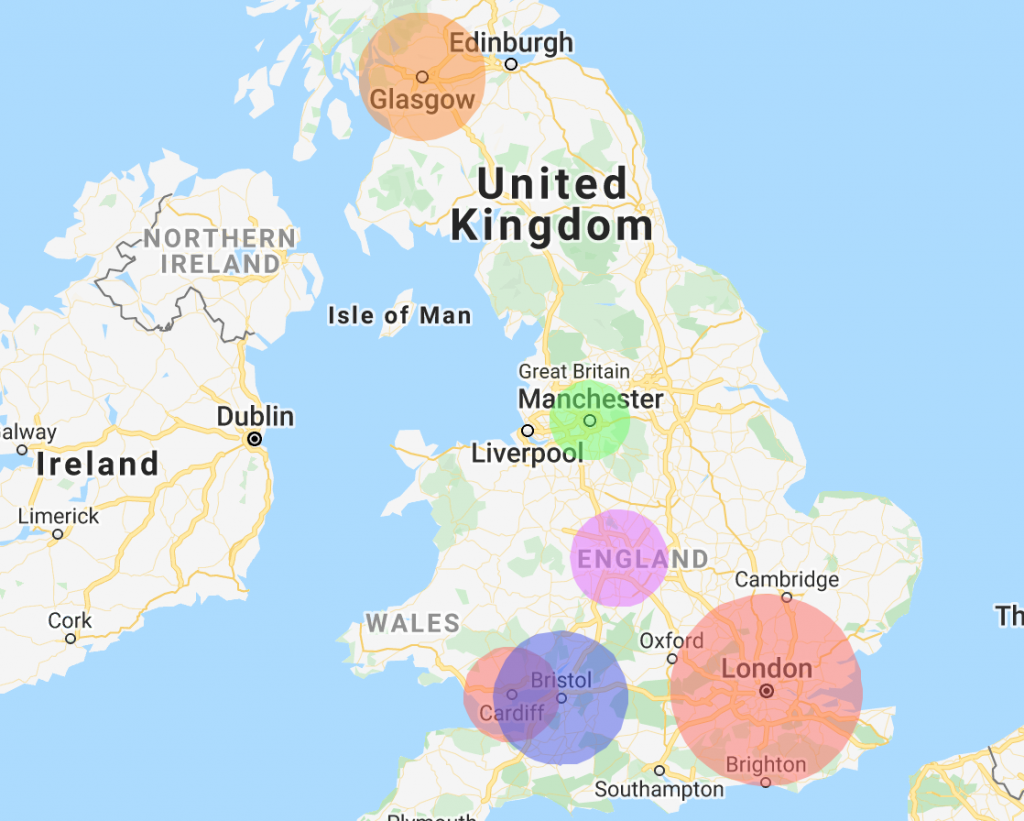
We thought it was time to add the function to upload a radius map. ZeeMaps allows you to upload spreadsheets with pins, or with highlighted geographical areas like US zip codes or counties. Now you can highlight circles on the map with different radii, using spreadsheet uploads.

To upload a spreadsheet of data as circles, add a column called ‘Radius’ to your spreadsheet. Specify the radius in miles or kilometers for each of the rows. On rows where you do not have a radius specified, you can define a default radius. Therefore, if you want all your circles to be of the same radius, you do not need to create a radius column – just specify a default radius.

How to upload a spreadsheet to create a radius map

To get started uploading a spreadsheet with circle markers, you can do one of two things:

  1. Select the ‘Additions’ > ‘Add (Upload) Multiple Markers’ menu item on your map, or
  2. Click the ‘Map My Spreadsheet’ button.

You will be presented with a dialog to pick a file to upload. Along with the file, there is an option to specify what kind of markers you would like to add. Make sure you select the option that says ‘Circles’, as below.

This image shows the upload data page and how to upload as circles.
Select the option to upload circles on a map

After you have selected a file and hit submit, the next dialog will give you the option to select your radius column, choose the default radius, and select whether the radius values are in miles or kilometers. Even if you are not using the default radius, and have specified radius values for each of your spreadsheet rows, make sure you check the appropriate box for miles or kilometers, depending on how your radius values are specified.

This image shows the default radius option and also the circle radius column.
Circle radius column and default radius

Just like any other spreadsheet upload, the circle markers can have different colors and additional information in them that will be visible once you click on the circle.

The benefits of circle markers

Circle markers can be helpful if you have multiple service persons and jobs spread throughout a geographical area. They can help you to quickly understand which service person to assign to which job, depending on distances.

Las Vegas Zip Codes Spreadsheet Uploaded to a Map

ZeeMaps now allows you to highlight US Zip Code areas on a map by uploading a spreadsheet with address and color information. Previously we supported highlighting regions only few at a time. As an example, in this blog post, we’ll show you how to highlight all the Las Vegas zip codes on a map.

Las Vegas Zip Codes Spreadsheet

We collected all the the las vegas zip codes and put them in a spreadsheet. A small sample of the spreadsheet is shown below:
City, State, Zip Code, Color
Las Vegas, NV, 89101, red
Las Vegas, NV, 89111, blue
Las Vegas, NV, 89102, green
Las Vegas, NV, 89103, red
Las Vegas, NV, 89106, blue
Las Vegas, NV, 89107, green
Las Vegas, NV, 89109, red
Las Vegas, NV, 89128, blue
The complete spreadsheet of the Las Vegas zip codes can be downloaded from: Las Vegas Zip Codes.
We’ve added the “color” column to our table to indicate which color we’d like to use to highlight a specific zip code. You can modify the color later once the map has been created. ZeeMaps supports 31 different colors that can be used for spreadsheet uploads. For a complete list of supported colors, see the menu item Map -> Legend on your map.

Upload Las Vegas Zip Codes Spreadsheet to a Map

Create a map and then use the menu item Additions -> Add (Upload) Multiple Markers. This will result in a dialog that asks for the spreadsheet file:

Upload Spreadsheet to Map for Las Vegas Zip Codes

In this dialog, as shown in the figure above, you can select the option to upload the data as pins or as highlighted areas for the zip codes. Since we want to create a map with zip codes highlighted, we’ll chose the option of “US Zip Code Regions”.
The spreadsheet can be in Excel file format or a CSV file. You can also copy-and-paste data from a table, or attach a spreadsheet maintained on a Google Drive. The advantage of using a spreadsheet on a Google Drive is that you can have the map be automatically updated based on changes to the spreadsheet.
Once you submit the data, a dialog will ask for confirmation of the column mappings to the field values. Make sure your columns are assigned to the appropriate fields, otherwise the data may not be mapped correctly.
Confirm column mappings for Las Vegas zip codes upload

Las Vegas Zip Codes Map

After you confirm the column mappings, the highlighting of zip code areas will start. It may take a few minutes for large files. You’ll get an email report when the upload is finished. Refresh your map and it should show you the highlighted areas. Our interactive map of Las Vegas zip codes is embedded below.

Click on a highlighted zip code to see more information determined from the additional columns of your spreadsheet. In the information bubble, you can click on the title or name to get an edit dialog to make changes to that specific entry, including the ability to change the color.
When highlighting regions through spreadsheet uploads, the normal region limits apply: 5 for Basic (free) plan, 10 for Professional, 25 for Professional Publisher. In addition, the Enterprise plan is restricted to 5,000 highlighted regions through spreadsheet uploads. If you need more, please contact us for special provisioning.


Auto-Update Map from Google Drive Spreadsheets

When mapping locations from a spreadsheet on a Google Drive, you can set up auto-update such that changes to your spreadsheet are periodically reflected in your map.
The spreadsheets can be stored as Microsoft Excel, CSV, or Google Spreadsheet files.
To enable this, create a map using one of the “Create a Free Map” button.
Then, go to the Additions menu and select Additions -> Upload (Copy-Paste) Spreadsheet, and then select the Cloud Drive Spreadsheet Option.

In the Cloud Drives drop-down, select the Microsoft OneDrive option for the Provider control, and hit the Fetch My Spreadsheets button.

ZeeMaps will ask you permission to access your Google Drive files in ReadOnly mode. We only ask for Read permissions, so we will never modify your Google Drive files or data in any way.

Select the spreadsheet that you want to upload, by clicking on the checkbox near the spreadsheet’s name.
Next, confirm your upload settings. Make sure at this point you assign columns appropriately, e.g, name -> Name, street address -> Street, city -> City, etc. You can double-click on the assignments to get a list of standard fields to choose from.
Check the box that says: “Regularly update from Cloud Spreadsheet”.


Hit Submit, and wait for a little while. Then, refresh your map to see if the data is being uploaded.

Add Map Markers of Different Colors via Spreadsheet

Suppose you want to add different colored markers, based on a certain column in your spreadsheet, e.g., to distinguish Hospitals and Clinics.
Add a column called “Category” to your spreadsheet, and then enter values such as “Hospital” and “Clinic” in the relevant cells.

ZeeMaps will automatically assign a different color to each category.
If you want to specify the color yourself, then before you upload the spreadsheet, add a legend using the Map -> Legend menu item. Specify the legend values “Hospital” and “Clinic” for the appropriate colors.

The matching is case-sensitive, so make sure that your legend values and category values are exactly the same.

To delete a legend value, empty the legend value in the Map -> Legend dialog and hit submit.

If you want to color markers differently, but not necessarily have a legend, then you can also use color names like blue, green, yellow, etc., in your spreadsheet cells. For a complete list of colors, see the menu item Map -> Marker Icons on your map.

Revised upload limit for Basic plan

ZeeMaps enforces an upload limit for uploading geographical location data through spreadsheets. The upload limit is such that after a spreadsheet upload, the number of entries on your map cannot exceed your upload limit.
Until recently, our Basic (free) plan allowed up to 500 entries to be uploaded per map. Starting today, due to increased operational costs, the upload limit for Basic plan will be set to 100.
This limit does not apply if your data already contains location information (latitude, longitude), or if you add markers one by one (e.g., through crowd source).
Please let us know if you need some time to adjust to this change.