As the federal government shutdown stretches beyond 40 days—the longest in U.S. history—the effects are rippling through the nation’s airspace. The Federal Aviation Administration (FAA) has announced that nearly 40 major airports across the country will reduce flights by up to 10%, citing mounting pressure on unpaid air traffic controllers and ongoing staffing shortages. We’re tracking these flight changes with our FAA flight reductions map 2025.
Starting November 7, the FAA will implement phased cuts:
- 4% reduction on November 7
- 5% reduction on November 8
- 6% reduction on November 9
- 10% reduction beginning the following week (November 11)
Officials emphasized that the decision aims to maintain safety standards amid the strain on aviation personnel. Around 13,000 air traffic controllers and 50,000 TSA screeners continue to work without pay, with many forgoing shifts due to financial hardship.
FAA Flight Reductions Map 2025
To better understand where travelers are most affected, we created an interactive map on ZeeMaps highlighting every U.S. airport facing flight cuts. Each marker includes key information:
- Airport name and code
- Projected number of flight reductions
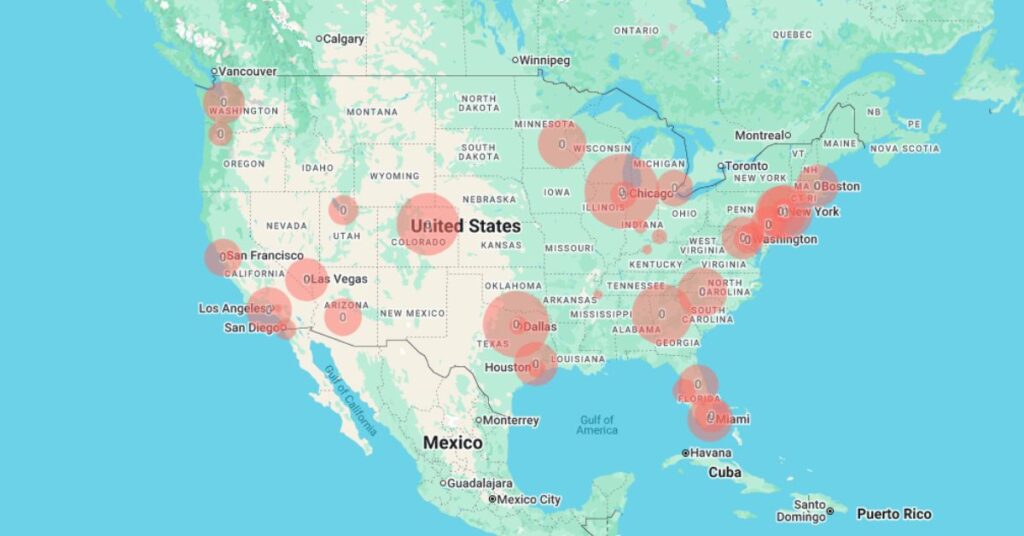
Map Update: Flight Cancellations as of Nov. 11, 2025
This map features all of the affected airports as of November 11, 2025, with the radius of the circles representing the proportion of flights cancelled per airport.
For example, LaGuardia Airport is represented by the largest circle on the map based on the fact that it saw 10.7% of its flights cancelled on November 11. Charlotte Airport, which only saw 4.8% of its flights cancelled, is represented by a proportionally smaller circle.
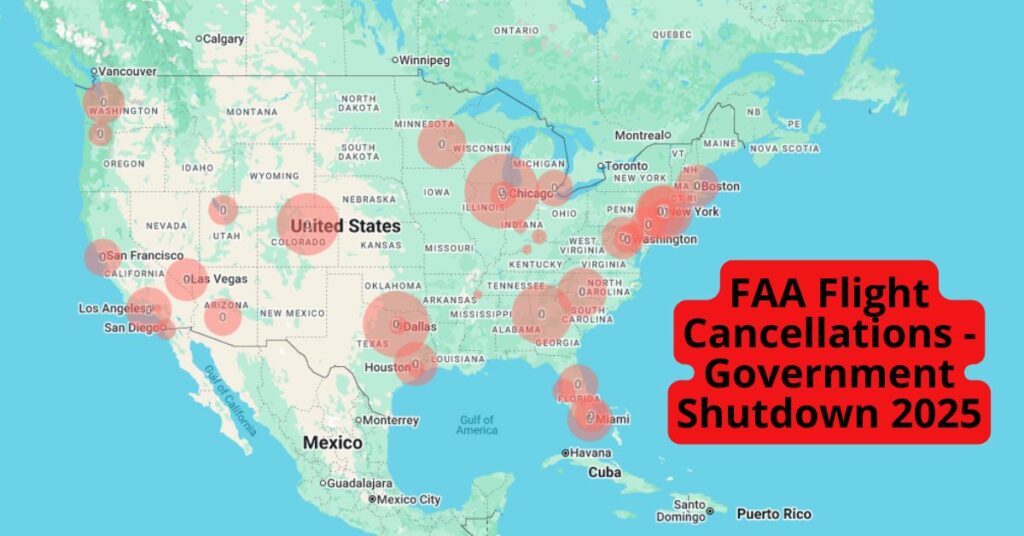
Flight Cancellations as of Nov. 7, 2025
This map features all of the affected airports as of November 7, 2025, with the radius of the circles representing the number of flights cancelled per airport.
By visualizing the data, it becomes clear how widespread these cuts are. From New York’s JFK and Chicago O’Hare to Dallas/Fort Worth and Los Angeles International, travelers in hub cities are expected to feel the effects first, as airlines consolidate routes to maintain efficiency.
Track the Situation in Real Time
ZeeMaps allows travelers, analysts, and journalists to track live updates as new airports are added or restrictions change. As the situation evolves, our map will continue to visualize where and how travelers are being affected.
Visit ZeeMaps.com to explore this and other real-time mapping projects tracking critical events across transportation, healthcare, and logistics.