A political map focuses on the boundaries and locations of political entities such as countries, states, cities, and administrative divisions. It displays human-created boundaries and lines rather than topographic features, and it’s main purpose is to visually represent the political organization and structure of a region. This type of map provides information about countries, states, provinces, cities, and administrative divisions within an area.
Political maps are useful tools in education, diplomacy, research, and as visual references for general knowledge. They typically show countries with distinct colors or shading, capital cities marked with symbols, state and province boundaries, major cities, national borders, bodies of water, major landforms, and administrative divisions.
Political Map Definition
A political map is a type of map that focuses on the boundaries and locations of civic entities, such as countries, states or provinces, cities, and other administrative divisions. It usually displays each country’s capitals and major cities, and sometimes includes other information such as major transportation routes, national borders, and bodies of water.
The main purpose of a political map is to provide a visual representation of the bureaucratic organization and structure of a region. Importantly, political maps display human-created boundaries and lines, whereas physical maps display topographic features and borders.
What is a Political Map Used For?
A political map is primarily used to understand the political boundaries and divisions of a region. It helps viewers gain knowledge about the countries, states, provinces, cities, and administrative divisions within a particular area.
Some of the most common uses include:
- Education: In schools and educational settings, political maps teach students about the political geography and structure of different regions.
- Diplomacy and International Relations: Crucially, political maps are essential tools for diplomats, governments, and international organizations to track and negotiate boundaries, resolve territorial disputes, and understand geopolitical contexts.
- Research and Analysis: Researchers, geographers, and analysts use them to study trends, analyze voting patterns and demographic information, and conduct spatial analysis.
- Reference and Information: These tools are in reference books, atlases, and online resources that serve as a visual reference for general knowledge about the world and its political divisions.
What Does a Political Map Show?
A political map shows various governmental features and boundaries of a specific region, country, or the entire world. Some of the key information typically displayed on these includes:
| Map Feature | Description/Purpose |
| Countries | Clearly defined boundaries of different countries, each differentiated by distinct colors or shading. |
| Capitals | Capital cities of countries or states are typically marked with a star or symbol to denote their significance. |
| States/Provinces | Boundaries and names of states, provinces, or territories within a country. |
| Cities | Major cities and towns are usually labeled or represented with different symbols to show their importance. |
| Borders | National borders between countries are clearly delineated, often using solid lines or different colors. |
| Bodies of Water | Oceans, seas, lakes, and rivers may be shown to provide context for the political boundaries. |
| Major Landforms | Mountain ranges, deserts, and other prominent landforms may also be included on political maps for reference. |
| Political Divisions | Political maps may also depict administrative divisions, such as counties, districts, or regions within a country. |
Political Map Examples
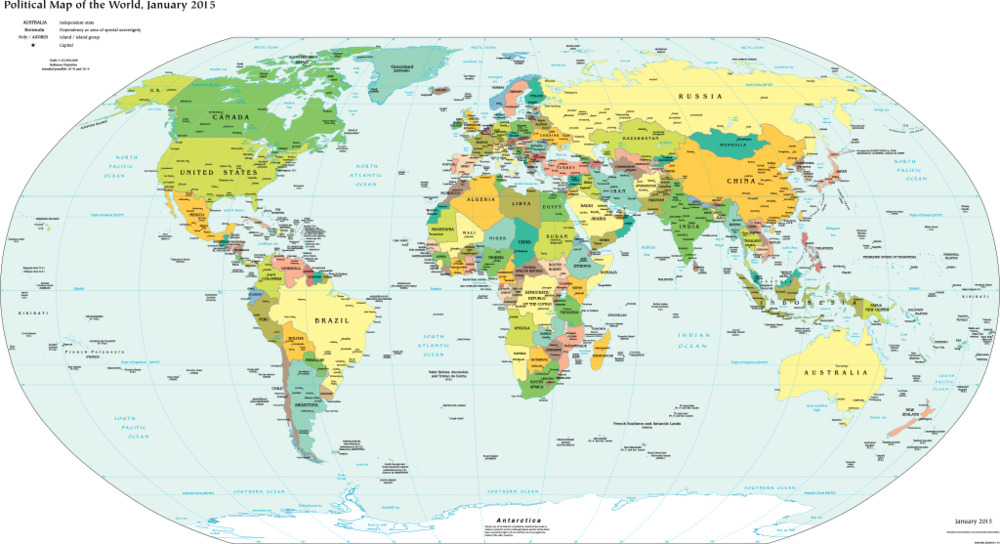
1. Political Map of the World
An updated political map of the world displays all of the borders between countries across the globe. By using different colors for each country, it’s clear where the boundaries and borders lie. This map also displays bodies of water and other key features, such as the equator line.
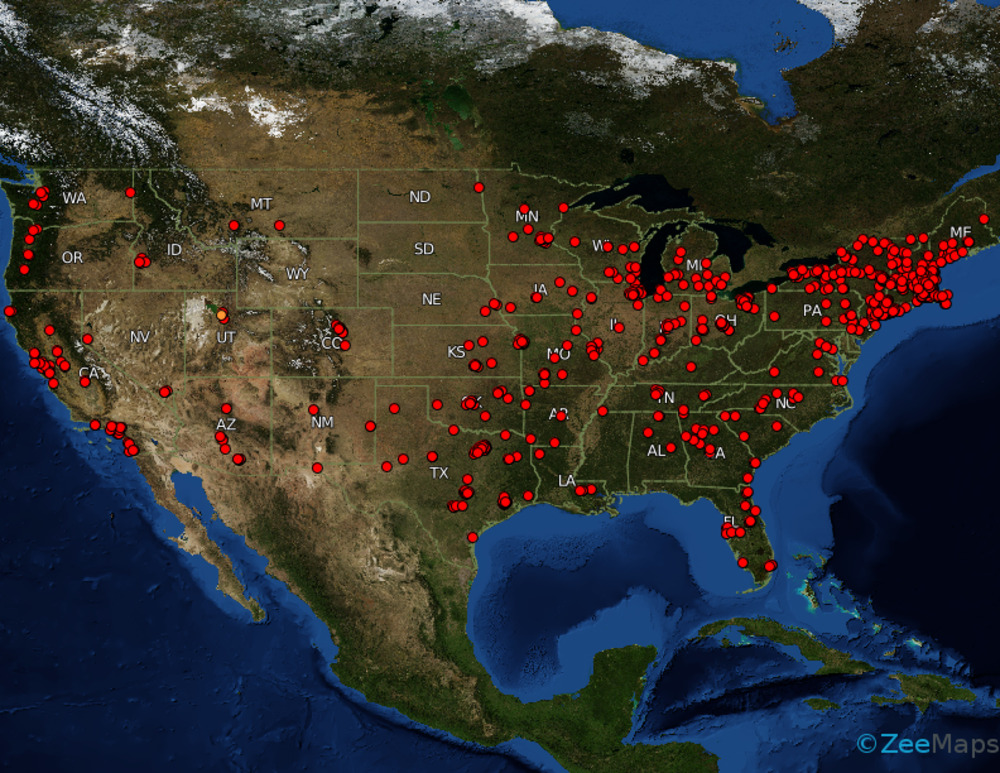
2. Political Map of the United States
In a political map of the United States, all the state borders are present. Other features are also visible in this satellite view, like mountain ranges and bodies of water.
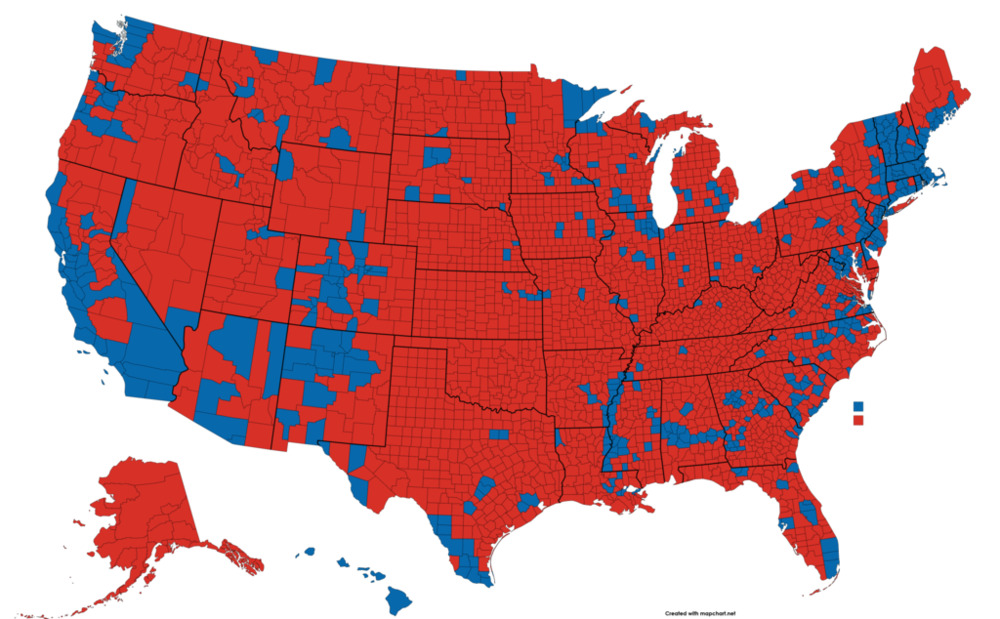
3. Election Map
Another common type of political map is an election map. They show political borders for states, and often counties. They show where political allegiances lie in federal elections, like in the example below from the 2020 presidential election.
How to Create Your Own
It’s easy to create your own political map with ZeeMaps. Using tools under “Additions,” such as “Highlight US County” or “Highlight US Zip Code,” you can display political boundaries. You can also use a map template that displays state boundaries and other geographic features.
Here is a step-by-step guide on how you can create yours using ZeeMaps:
- Log in to ZeeMaps or sign up for an account.
- Click “Create a Map” to create a new map.
- Upload your data set to the map.
- Adjust your preferences to display different functions relating to political boundaries. Under “Map,” then “Settings,” you can draw boundaries for the regions you’ve uploaded in your data set, including US Zip Codes or Counties, for example.
- Label key sections, such as city capitals, buildings, or other important areas using “Additions,” then “Add Marker.”
- Don’t forget to save your map once you’re done customizing it. Use the tools under “Print or Share.”
Inspired by this map?
Create your own interactive map with ZeeMaps in minutes.