US state map using extended colors

We encourage you to read this blog post fully, as there is a link to a free US State Map at the end!
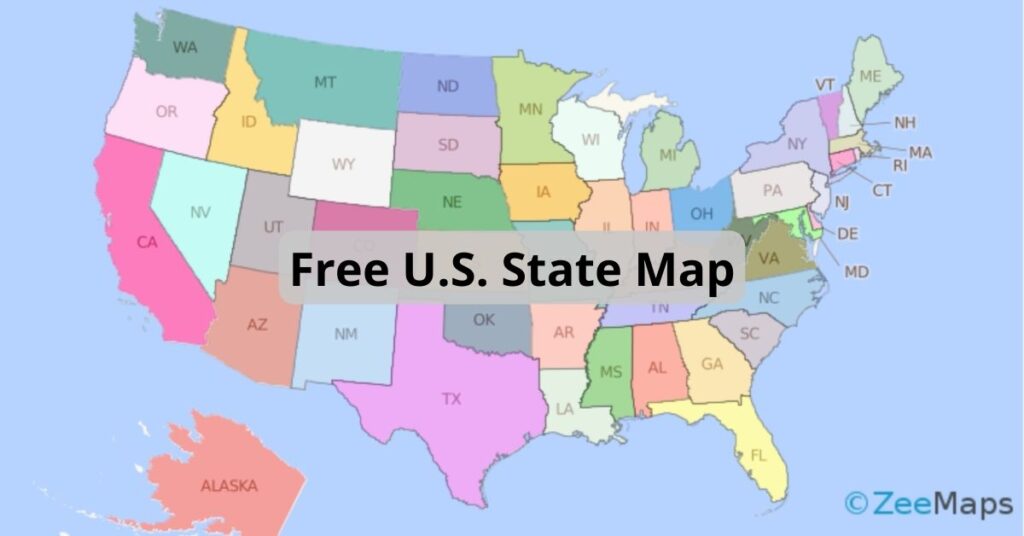
ZeeMaps has more than doubled the colors available to users with an Enterprise Plan. It means you can group markers into 75 different colors instead of just 32. This comes in handy when you are coloring a US state map, or other maps with multiple regions. The six palettes contain shades from teal to princess perfume, sunglow to cyber grape.
You can view the different color palettes in the tabs at the top of this page. All ZeeMaps users have access to the Classic palette. Only users who have signed up for the Enterprise plan have access to the next five palettes (Red; Yellow-Orange; Green; Blue; and Violet).

Color your US state map with extended color palettes

Use the extended palette on your US state map

To use the extended palette, you must set it up for each map. How? Go to Map > Settings and select the ‘Markers Display’ tab. Set the option for ‘Use Extended 75 Colors’ and hit ‘Save Changes.’ This will enable you to see the extended colors on that particular map.
For additions, go to Additions > Add Marker (Simple) or Add Marker (Detailed). Whether you select Simple or Detailed, both will show the color options based on the map settings. With extended colors, you’ll be able to chose from among 75 colors.

Upload a spreadsheet with multiple colors

To upload a spreadsheet with multiple colors, set a column for ‘Color’ or ‘Category’ on your spreadsheet. If you use ‘Color’, choose the color names listed on this page. If you set a column for ‘Category’, you can specify different values in the rows and ZeeMaps will assign a different color to each different value –  starting with the shade that you select for ‘Default Color.’ Once you have finished your spreadsheet, go to Additions > Add (Upload) Multiple Markers.
As an illustration, we will use the following spreadsheet to create a multi-colored US state map:

Spreadsheet for US State Map
Spreadsheet for US state map

US State Map with 50 Colors

Based on a well known mathematical four color theorem, you need only four different colors for coloring a map, in order that no two adjacent regions have the same color. Although it is technically feasible to limit ourselves to four colors, that is not necessarily appealing  – especially if different shades are used to indicate variations in some indicator, e.g., population density. Here’s an interactive map that we created with 50 colors for US states.

You can use the ZeeMaps Print or Share capability to get an image of your map. In the Print or Share menu, select the option for PDF/PNG Image. In the resulting dialog, use the setting ‘US Map’ for Geography and make sure it is a ‘Simple’ US map and not a ‘Colored’ one.

US State Map
US state map with extended colors

We are giving away a high-resolution poster-sized image of this US state map, so if you like what you see you can download it here for free. This image was created with ZeeMaps, by setting the size of the image to poster and resolution to 300 DPI.
We hope you enjoy using your more colorful ZeeMaps!