IF Function in Excel – IFS Function in ZeeMaps

A type of IF function in Excel is the IFS function in which you can input multiple conditions to determine cell values. The function is checked from left to right for the multiple conditions, and the value set for the cell is determined by the first condition that is met. IFS is a much easier way of testing for multiple conditions instead of nesting multiple IF functions.

This statement is extremely helpful when we want to make one field value dependent on another. For example, if the score is => 80, then the Grade is B; if the score is =>90, then Grade is A.

In this post we will show you how to assign different colors to pins or highlighted regions when you upload a spreadsheet. We will use a spreadsheet that has zip codes in the US with a column for number of dealers in that zip code. The sample spreadsheet is attached to the bottom of this post and has just two columns, ‘zip code’ and ‘dealers’. We’ll add a third column – ‘colors’.

Find the Color Name

First, for this task we need to take a look at the color options in ZeeMaps, which are listed here. All ZeeMaps users have access to 32 colors and users on our Enterprise plan have access to 72 colors. To use the extended color palette, please see our blog post.

Color Name for Excel IF Function

For our IF Function, we will need to assign different color values based on values in a given column of our spreadsheet, e.g., number of dealers, grades, etc. For this purpose, note the Color Name in the color list. Use this as the color value in your expression.

If Function Excel Color Choices
IF Function in Excel Color Choice Example

How to write the Excel IF Function

Generally, the syntax for the Excel IFS function is:

=IFS([Something is True1, Value if True1,Something is True2,Value if True2,Something is True3,Value if True3)

The Excel IF Function allows you to test up to 127 different conditions.

Note that the conditions need to be entered in the correct order, and can be very difficult to build, test and update if you have entered a large number of conditions.

The Expression – Excel IF Function

We entered the following Excel IF Function expression for our example below. Since our spreadsheet column B contains the number of dealers, we’ll enter an IF Function expression in cell C2 as follows:

=IFS(B2 <= 5, “Green”, B2 <= 10, “Light Yellow”, B2 <= 15, “Yellow”, B2 <= 20, “Red”)

If Function Excel Expression
Excel IF Function Spreadsheet Example

Then, we copy the formula to the rest of the column C and voila, we have colors for each of the zip codes! You can find our example spreadsheet at the end of this tutorial

A look at our IF Function Map

For more info on IF Function Excel visit Microsoft’s detailed instructions for some helpful tips.

Example Data Download

Click the download button below to view our example data excel spreadsheet

Heat Map Visualization in ZeeMaps

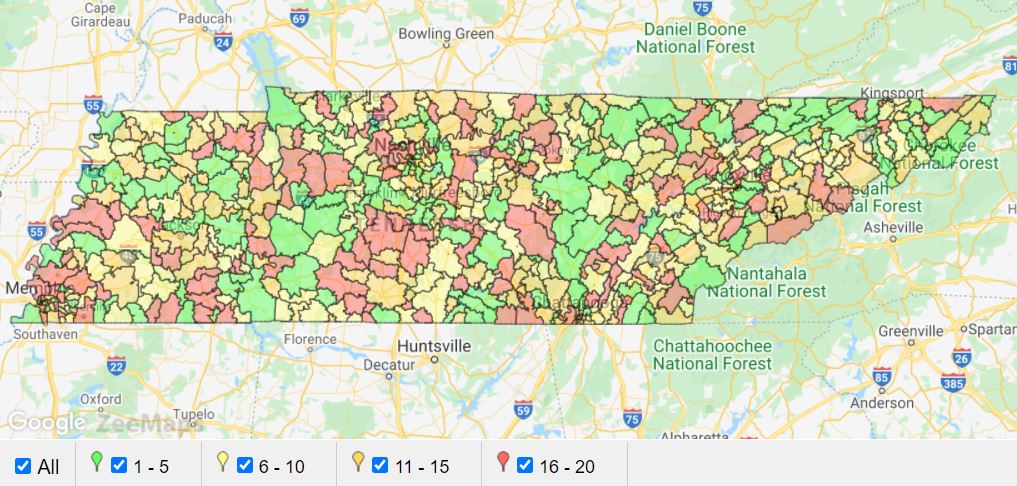
Heat Map Overview

Heat map, a density visualization technique, shows areas of high and low concentration on a map. While, a point map with 10’s of thousands of locations can become cluttered, a heat map visualization of the same data can quickly show areas of dense population.

For example, if you plot the locations of all your customers as a heat map, you can quickly see where there are pockets of low or high number of customers.

ZeeMaps provides support for a these maps in both the interactive and print versions. Currently, we look at the frequency, or number of points at a given location, to determine the density. Over time we’ll extend this to allow for the density value to be determined through one of the the marker fields.
Notice, you can combine this feature with the Zip Code Finder tool in ZeeMaps.  Finally, a great way to quickly determine the zip codes with high density of points on a map!

Example Map

Here’s an example of a heat map of locations of all the Used Computer Stores in the US. First, with the map, one can quickly see that Boston and New York are the most dense areas. While, other major cities like San Francisco, Dallas, etc., have some notable presence as well.

Now, click on the icon at the top right of the map. Notice, the display will change to the regular clustered point map.

We can also get an image of the same map, using the menu item Print or Share -> PDF/PNG Image. In the resulting dialog, we check the option for “Heat Map” for the pin style.

Heat Map of Used Computer Stores in the US
Map of Used Computer Stores in the US

Setting a Heat Map in ZeeMaps

Turn on the this feature for your map. First, go to the settings page (menu Map -> Settings). Second, click on the Map Display tab. Third, check the box for “Enable Heat Map” and hit Save Changes. Last, go back to the map to view the change. Finally, there will be a small icon at the top right of the map (see interactive map above). You can click on that icon to toggle the display from a heat to a regular point map.

Enable Heat Map in ZeeMaps
Enable in ZeeMaps