Organize your map data in two dimensions
We introduce Map Layers as a foundational new feature for organizing your map data. With layers, you can use ZeeMaps to efficiently visualize and analyze large datasets.
Until now, ZeeMaps provided one dimension to categorize data. The categories were visible through different colored pins, allowing users to quickly visually analyze and display multiple categories. Map Layers introduce a second, orthogonal dimension, giving you much more expressive power without making maps more complicated.
Map Layers lets you include one map inside another as a layer. Any changes sync immediately in both directions—edit the included map directly or through the parent map, and both stay up to date. Combine this with the powerful ‘share’ mechanism in ZeeMaps to share smaller maps with multiple users while retaining control over a ‘master’ map that manages maps for multiple users.
As with categories, you can use spreadsheet uploads to quickly map data into multiple layers. Just point ZeeMaps to the ‘Layer’ column in your spreadsheet during the upload confirmation process.
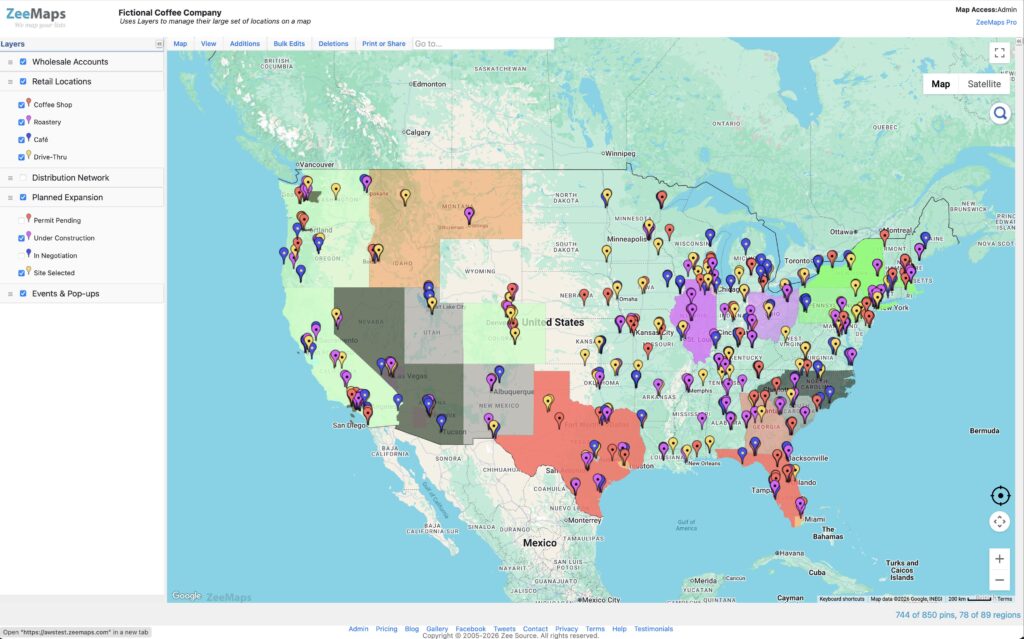
Below we show a sample map for a fictional coffee company. The company has plotted layers for its Wholesale Accounts, Retail Locations, Distribution Network, Planned Expansion and Events & Pop-ups on a single map on ZeeMaps. Each of the layers has pins in different colors with their own legends.
In the following we will describe step-by-step directions on how to use the map layers capability in ZeeMaps.
What Are Map Layers?
A map layer is a logical container for content, including:
- Markers and pins
- Highlighted Regions (polygons, circles, rectangles, us zip codes, states, countries, etc.)
- Annotations (text labels)
- Categories, colors, and legends
Maps can have multiple layers stacked on top of each other.
You can think of layers as transparent sheets:
- Each sheet holds a coherent dataset or purpose
- Each sheet has its own legend and visual rules
- Sheets can be shown, hidden, reordered, or muted independently
Creating and Using Layers
There are three ways of creating new layers on a map:
- Manually create new map layers
- Add another map as an included map in the current map
- Upload a spreadsheet with a ‘Layer’ column
1. Creating a Layer Manually
- Open your map
- Use the Additions → Add Layers
- Enter new layer names, one name per line
- Hit Submit
Once created, you can:
- Add markers, regions, or annotations directly into that layer
- Assign imported data to it
- Define categories and colors specific to that layer
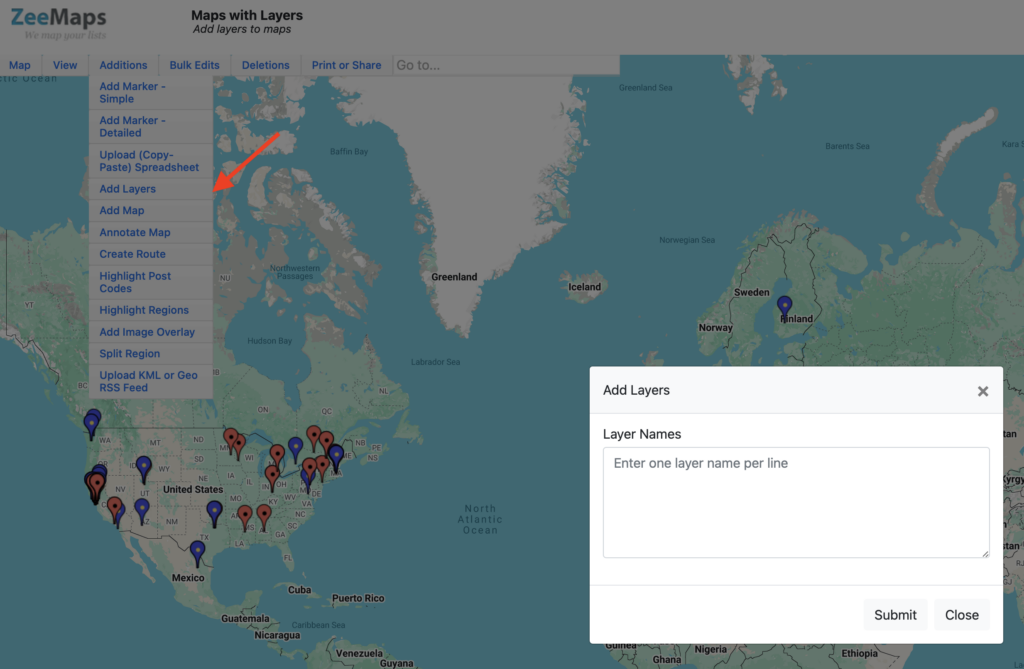
2. Include other maps as layers
- Open your map
- Use the Additions → Add Map
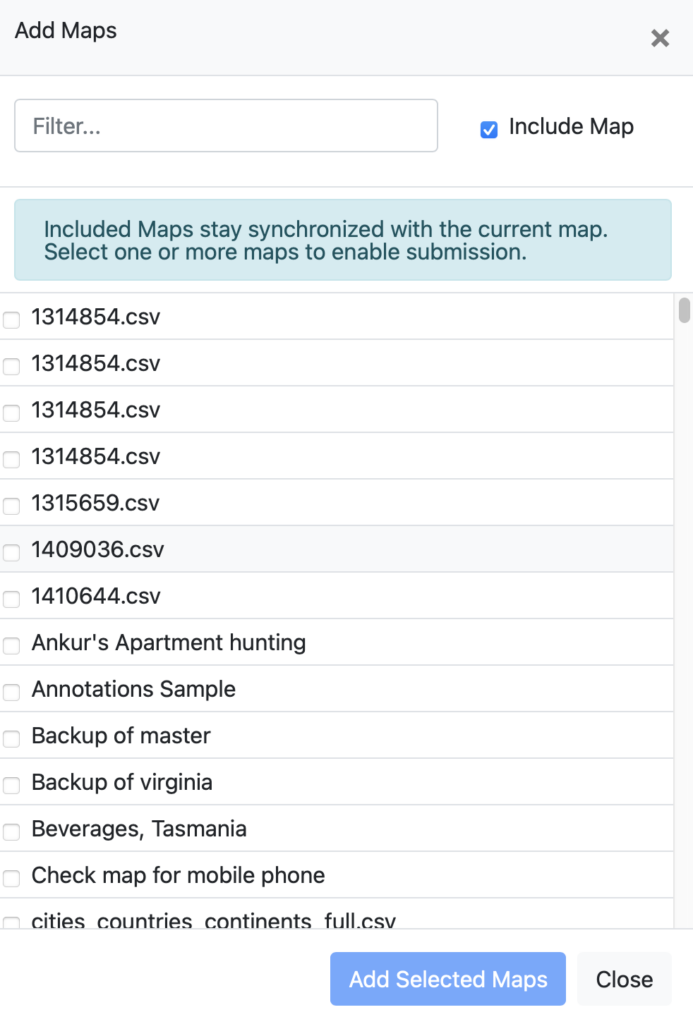
- Tick the checkbox for ‘Include Map’
- Select the maps to include
- Hit “Add Selected Maps”
3. Assign Data to Layers During Upload
When uploading spreadsheets, you can assign rows to layers automatically by including a Layer column.
This allows you to import multiple datasets at once, already organized along the layer dimension.
How It Works
- Column headers containing “layer” are auto-detected
- Layer names are matched case-insensitively
- Layers are created automatically if needed
- Blank values fall back to the default layer
Example CSV
Name,Address,City,State,Country,Layer,Category
John Smith,123 Main St,New York,NY,US,Sales,West
Jane Doe,456 Oak Ave,Los Angeles,CA,US,Marketing,Digital
Result:
- “Sales” and “Marketing” become separate layers
- Each layer has its own legend
- Categories stay meaningful within each layer
Toggling Layer Visibility
Each layer has independent visibility controls.
Hide or Show an Entire Layer
- Click the checkbox next to the layer name
- The layer is fully hidden or shown
This allows you to:
- Focus on specific datasets
- Compare layers side-by-side
- Temporarily hide annotations or reference data
Toggling Color Visibility (Without Hiding Data)
Sometimes you want data visible, but not visually dominant.
Each layer lets you toggle color visibility:
- Markers, regions, and annotations remain visible
- Category-based colors are suppressed
- The layer renders in a neutral style
This is useful when one layer provides context while another is the focus.
Per-Layer Legends
Each layer maintains its own legend.
That means:
- Categories and colors are scoped per layer
- The same category name can exist across layers without conflict
- Legends stay clean and relevant
This is a direct benefit of the two-dimensional model.
Backward Compatibility
- Existing maps continue to work unchanged
- Older spreadsheets import normally
- Layers can be adopted incrementally
You don’t need to restructure existing maps to benefit.
Final Thoughts
Layers introduce a true second dimension of organization in ZeeMaps:
- Layers define what kind of data or context you’re working with
- Categories define how data within that layer is classified
Markers, regions, and annotations all benefit from this model.
Whether you’re organizing a single map or composing complex views from multiple maps, layers make maps clearer, more powerful, and easier to maintain.