ZeeMaps supports highlighting regions on maps, making it easy to visualize sales territories, service areas, or marketing reach. Highlighted areas are color-coded to distinguish among territories and now, with our latest update, you can add labels to your regions map for even more clarity.
Thanks to AI-driven text placement, ZeeMaps automatically positions labels for each region, keeping your map clean and readable.
Highlight Geographies or Custom Shapes
You can highlight geographies like US Zip Codes (Postal Codes), Counties, States, or geometries like circles, rectangles, polygons and even hand drawn regions.
Once you have a highlighted region, you can use it to:
- Fence off pins for filtering or editing,
- Delete all pins in a region,
- Search and export pins that satisfy certain conditions.
These tools make your highlighted regions both interactive and actionable.
How to Highlight Regions on a Map
You can highlight regions in one of two ways:
- Spreadsheet Uploads – Great for bulk highlighting of geographic areas such as ZIP Codes or counties.
- Manual Addition – Use Additions → Highlight Regions or Additions → Highlight Post Codes from the menu to add regions individually.s.
Each method offers a slightly different way of assigning labels to regions.
1. Spreadsheet Uploads with Custom Labels
When highlighting regions via a spreadsheet—for example, U.S. ZIP Codes—you can choose any field in your data as the label.
That means your regions map can display:
- Names of areas
- Annual sales or revenue
- Population counts
- Customer totals, and more
To configure:
- Open Map → Settings.
- Under Label Markers Using Field, select your preferred column.
- Click Save Changes at the top left.
Your regions map will now feature automatically labeled regions with meaningful data.
3. Labels with Highlight Regions Map Menu
If you manually highlight regions using Additions → Highlight Regions, ZeeMaps automatically labels them so your regions map stays easy to interpret.
By default, the label will be:
- The name of the color scheme, if using one, or
- The region’s name (ZIP code, city, or county).
This ensures your regions are clearly identifiable without additional setup.
4. High-Contrast Labels for Clearer Regions Maps
By default, labels appear muted so the map’s geographic details remain visible.
To make them more prominent on your regions map:
- Go to Map → Settings.
- Open the Markers Display tab.
- Check High Contrast Labels and click Save Changes.
This option helps your regions map stand out during presentations or print exports.
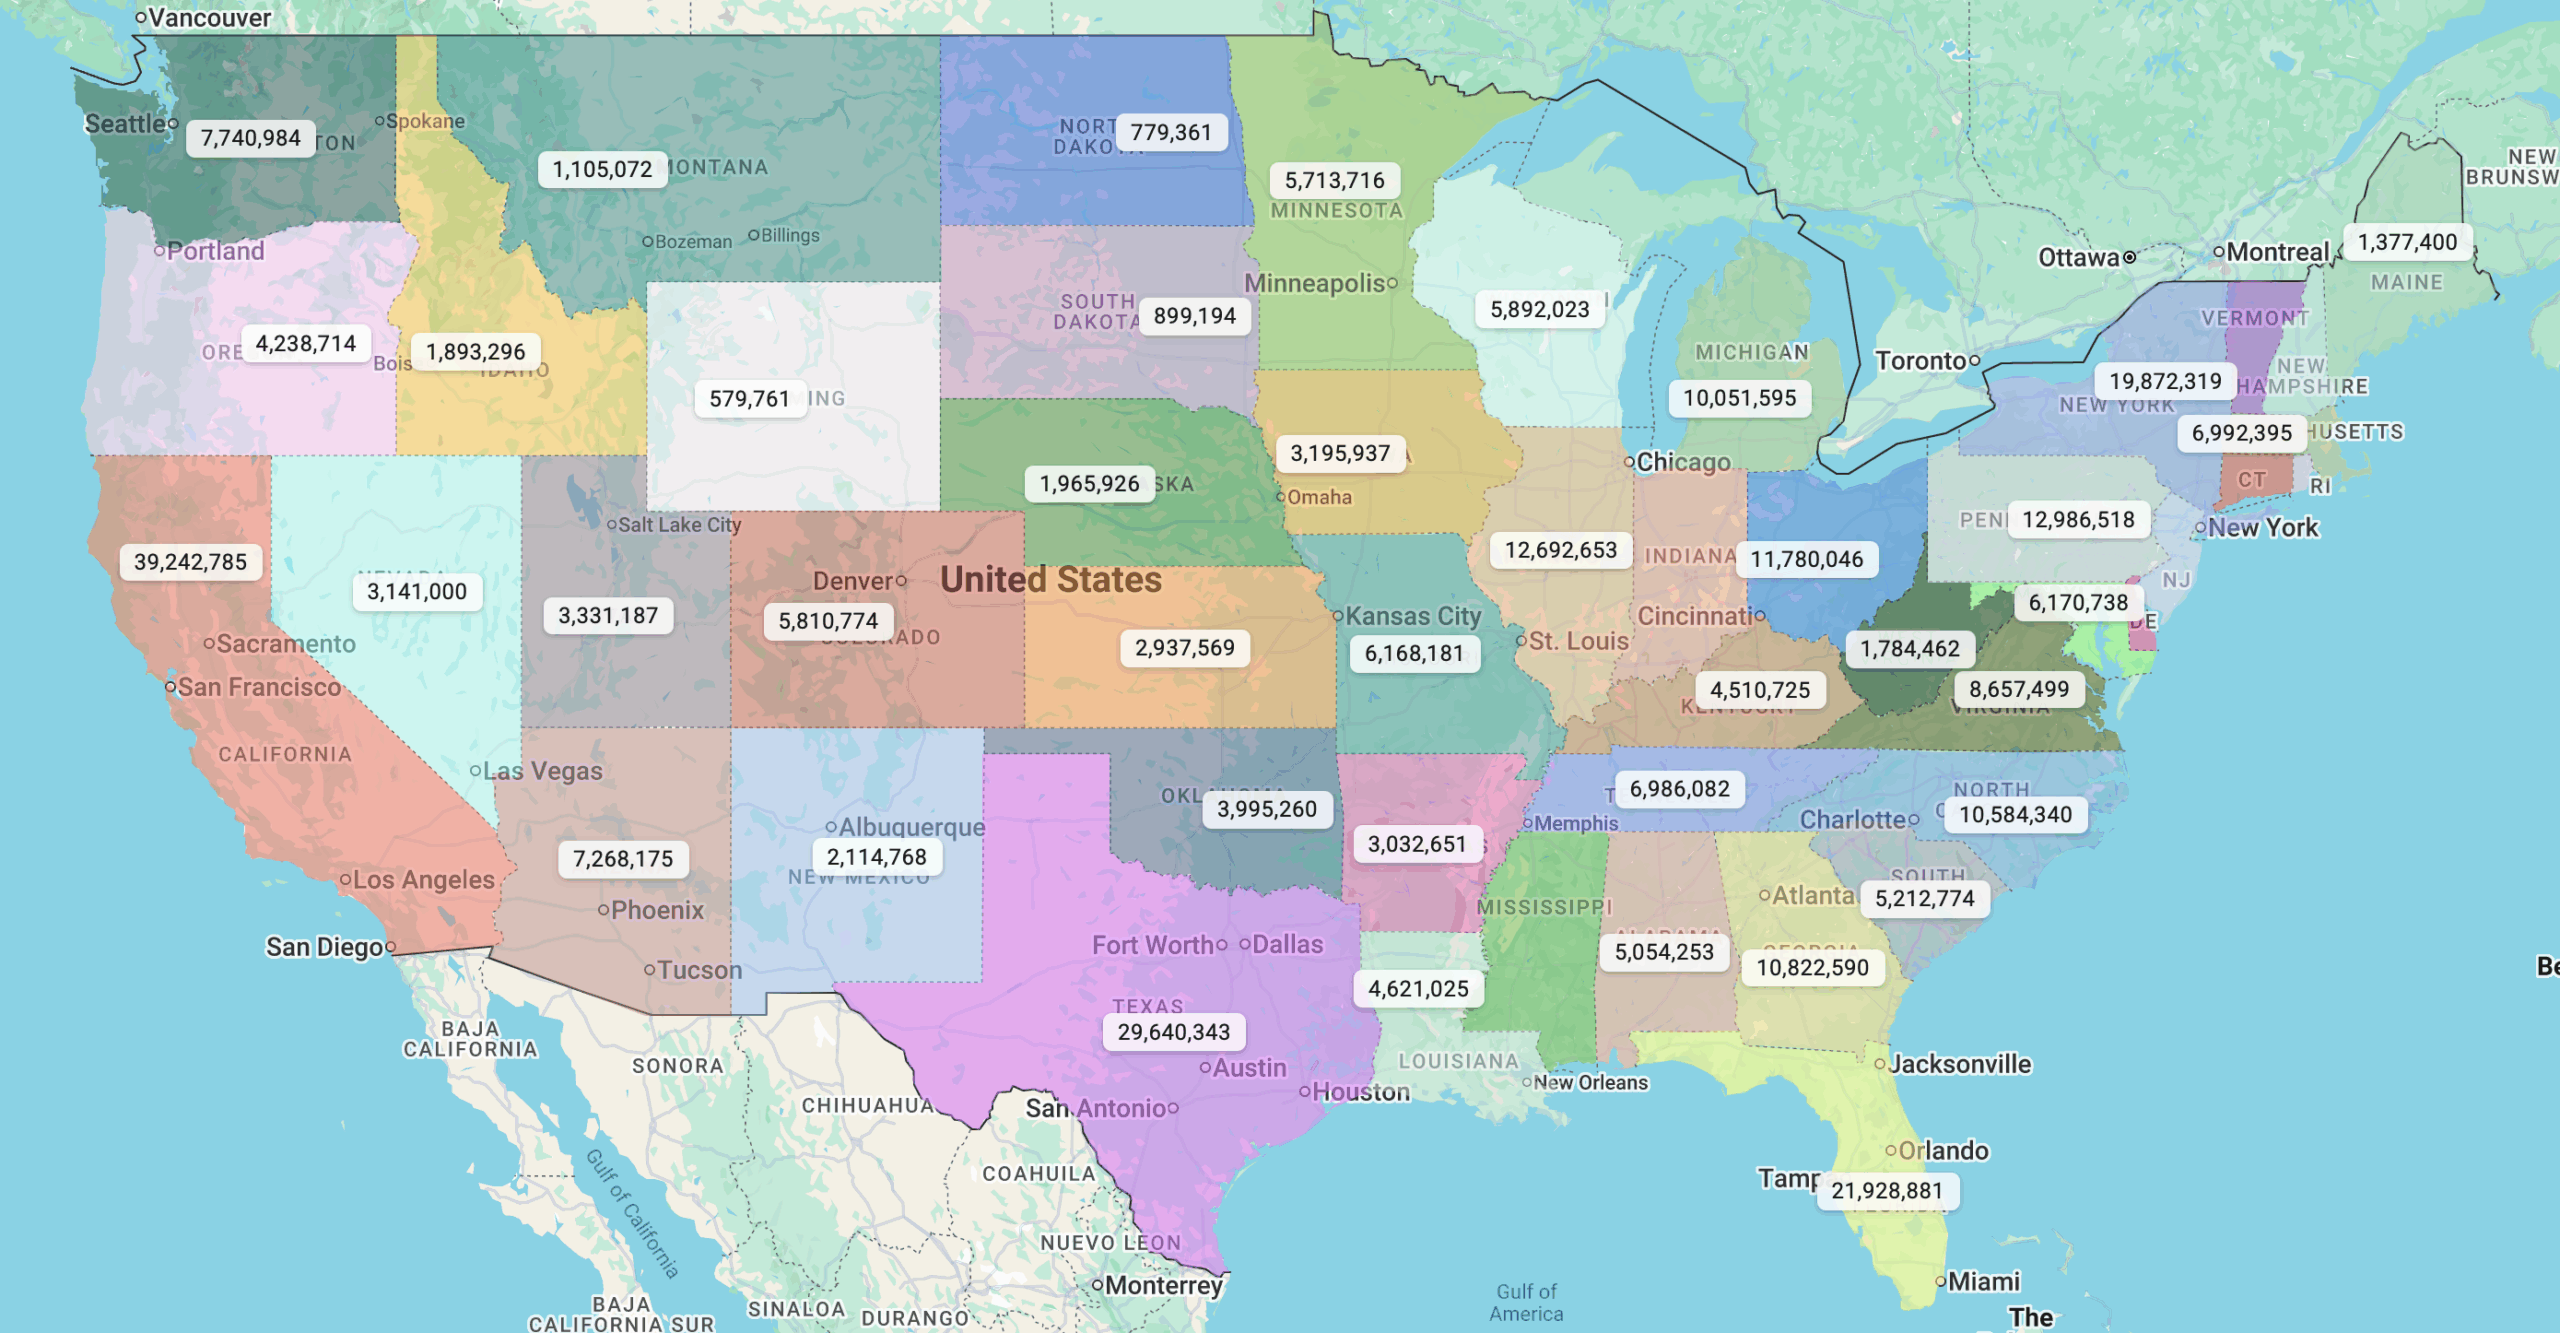
Example: U.S. States Regions Map with Population Labels
For example, we will show the US State map, that we have used before. This time we enrich it with US Census data, e.g., state population. We can now use the state population as the “label” for the highlighted regions.
Why This Matters
Labels help transform your maps from just being visually attractive to being highly informative and interactive. You and your viewers can now interpret the data more quickly and make better decisions based on the information displayed.
Try out region labeling today, and see how much clearer your maps can become.