Have you ever wanted to see US Census demographic data directly on your map? With ZeeMaps, you can now add official US Census Bureau demographics for ZIP Codes (ZCTA), Counties, and States to your maps — no coding or GIS expertise required. No need to pull the data from other sources.
Whether you’re mapping customer locations, planning sales territories, or analyzing community needs, this new feature lets you combine your own data with demographic insights like median household income, population, and household size — all in just a few clicks.
What Demographic Data Is Available?
We’ve integrated the most recent US Census Bureau datasets for three geographic levels:
- ZCTA (ZIP Code Tabulation Areas)
- Counties
- States
Available fields include (but are not limited to):
- Median household income
- Total population
- Age distribution
- Household size
- Education levels
This means you can enrich your map with reliable, government-sourced statistics — perfect for market analysis, outreach planning, and research.
How to add US Census Demographics to Your Maps
The process is simple and works with both pins and highlighted areas:
- Upload your spreadsheet to ZeeMaps.
- Pins: Each row is a location (e.g., customer address).
- Highlighted areas: Show coverage for ZIP Codes, Counties, or States.
- Select the geographic level for the demographics (ZCTA, County, State).
- Choose which demographic fields to add.
- ZeeMaps automatically matches each record to the correct geography and merges the US Census data with your dataset.
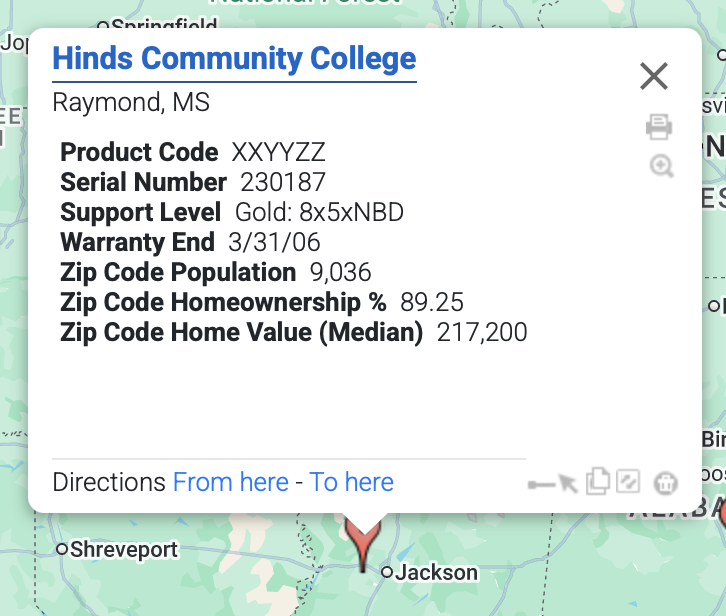
- View the enriched data on your map’s info bubbles — or export it for deeper analysis.
Step-by-Step Guide: Map Demographics data
Step 1 – Create or Open a Map
Log in to your ZeeMaps account. Create a new map or open one you’ve already made.
Step 2 – Upload Your Spreadsheet
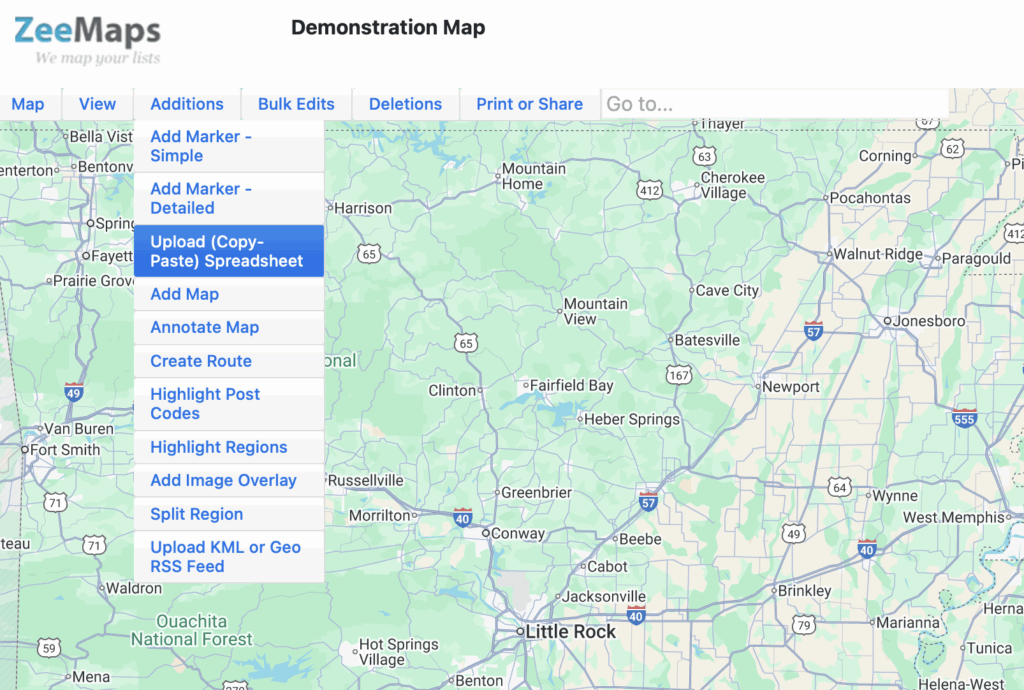
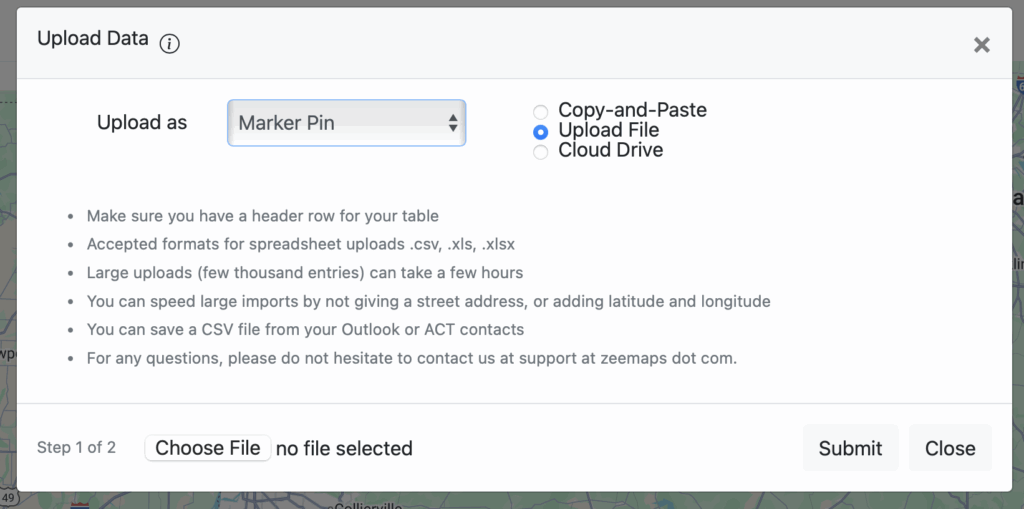
Use the menu Additions -> Upload (Copy-Paste) Spreadsheet on your map. In the resulting dialog, select Upload As for Marker Pins, or highlighted regions like US Zip Codes, US counties, for highlighting map geographical areas.
Step 3 – Choose the Geographic Level
In the Confirmation dialog of the upload process, Pick one of the following:
ZCTA (ZIP Code) – for customer addresses or service coverage areas.
County – for county-wide statistics.
State – for broader state-level trends.
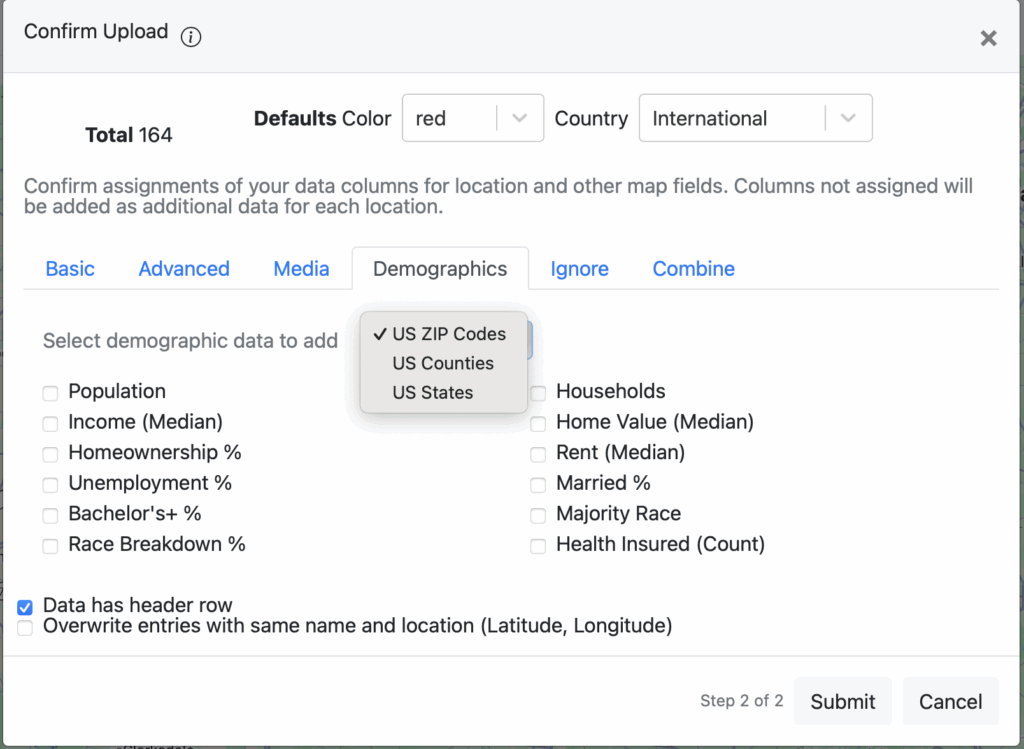
Step 4 – Select Demographic Fields
From the list, choose which fields to add:
- Median Household Income
- Total Population
- Households
- Age 65+
- Education Levels
…and more.
Step 5 – Review and Submit
Once uploaded, ZeeMaps combines your spreadsheet data with the selected demographics.
You can:
- View it on the map (in info bubbles or labels).
- Filter by demographic values.
- Export the combined data as a spreadsheet.
Example Use Cases
- Sales & Marketing – Identify high-income ZIP codes to prioritize outreach.
- Nonprofits – Focus on areas with higher poverty rates for targeted assistance.
- Political Campaigns – Map supporters alongside age and income distributions.
- Real Estate – Highlight neighborhoods by household size or education level.
Why Use ZeeMaps for Demographic Mapping?
- No GIS skills required – point-and-click simplicity.
- Official US Census data integrated automatically.
- Works with pins and highlighted regions.
- Export-ready for deeper analysis in Excel or other tools.
- Fully customizable maps — colors, filters, info bubbles.
Try It Now
Log in to ZeeMaps and start adding US Census demographics to your maps today.
You’ll turn plain location data into powerful visual insights in minutes.
Pingback: AI Map Generator with Real Data: The New ZeeMaps REST API
Pingback: Color Map by Data Value for Instant Insights - Blog